This manual chapter covers background information on how the advanced City Based Demand system works in AirwaySim.
Reading this manual chapter is optional and will give you information on how the economy model and worlds work in the simulation.
What Is City Based Demand?
The air travel demand amounts (demand = amount of passengers and cargo wishing to travel from place to another) in AirwaySim have been previously calculated between airports based on simple and non-dynamic statistics of airports. This data, enhanced with game-specific settings, was used to calculate the passenger/cargo numbers between any two airports in the simulated world. This old method can be called the Airport Based Demand system. It is rather static and it does not respond to player's actions.
The old Airport Based Demand system also meant that airports that have been traditionally big in the real life will remain big in AirwaySim always, since their relative passenger numbers do not change compared to other airports. A good example of this is Atlanta - it's one of the busiest airports in terms of passenger numbers in real life because a major US carrier is located there; without it the airport would be considerably smaller since the Atlanta region itself is not a major travel area or destination. The same effect was present in the old Airport Based Demand system (due to the statistical approach to the demand modelling).
The aim of the City Based Demand system is to move away from this logic where an "airport has a big traffic, just because it is big in real life regardless of where it is" and provide a dynamic world where player actions affect the region and airports. The new demand system, City Based Demand, aims to free players from the shackles of these traditional large real-world HUB airports making the passenger demand figures independent from the airports.
The benefits of the new system in a nutshell are for example:
- It makes the game worlds more dynamic by allowing players to develop airport traffic based on their actions; a small airport can grow to be a large one.
- Demand figures are no longer tied to traditional big airports; airports serve only as the gateways for the demand and traffic.
- It enables us to create a more detailed economic environment with regional changes in the economy (vs. global at current model).
- Historical accuracy of the economics is highly enhanced. For example the Gulf area (like Dubai) was a very small player in the aviation industry in the 1970s for example.
The key to understanding the new demand model is that passenger demand is no longer airport-to-airport, but region-to-region and airports only serve as the gateways between these two points. The specifications and real-life status of an airport have nothing to do with the potential demand the airport has anymore (i.e. even the small city airport will have the potential long-haul demand - but in practice in the games such demand will shift to other airports if no such services are provided).
Technical Background
To calculate the passenger and cargo travel desire between two points, we've split the world into predefined areas called squares. Each of these areas have certain values and specifications, such as population of the area. Using all this data we know for example which area of each country is a holiday resort or an important industrial center. This information can also be viewed at the airport maps - but understanding and viewing this data is purely optional and the data is made visible only for more detailed analysis.
This background data is dynamic and based on real history - for example the economy trends for each country are based on actual historical developments, and this allows us to model situations like local recessions in some country. These economic factors will affect directly to the travel demand figures since the need of air travel is highly dependant on country's economic status.
Here pictured, as an example, is the overall economic development (GDP) of a certain country. You can see the decline (recession) in mid-1990s and then a quick economic growth, followed by a another great recession in 2008. These changes will directly affect the air travel demand, and the economic environment is different for each country.

Using all this data the system will first figure out the total potential demand departing from each area to various destinations globally. This demand will be then assigned to the nearby airports.
The airport must usually be within the same country, but if the political situation allows border crossings all or some of the demand may also end up in nearby airports in the neighbouring countries. For example when Soviet Union was still in force it was out of the question for their citizens to first travel with car/bus/train to some nearby democratic country and fly from there, but after its collapse this has started to happen and the City Based Demand system takes such things into account.
Each airport has a designated catchment area which determines the range and amount of demand they can catch from these nearby areas. This catchment area changes over time based on the size of the airport and can be between 50 to 200 kilometers depending on the size classification of the airport. The total amount of demand each airport can catch then depends on the amount of local demand available from the nearby areas and on the specifications (catchment area) of the airport.
The final result is shown to players in the familiar airport-to-airport demand chart where the current potential demand values are visible. Additional information like the total possible demand from the entire region (called: potential demand) are also presented.
The demand will change over time when the catchment areas of airports change and when several airports compete over the same demand. These are explained in the next chapters - but again the user interface simply tells you the airport-to-airport demand numbers which allows to make easy decisions.
Economy Model
The model of micro-economy in the simulated world is based on real history, but it can be modified for each game scenario. The system is supplied with country- and area-level economical data and for example the detailed population data over each city and region. Combining this data and the specifications of each area the system will determine the economic climate in that region and its desirability as a destination, and of course the amount of traffic willing to travel from that area outbound.
In previous models the overall passenger demand was usually static or grew with a slow pace but in the new model the changes can go either way. If a country enters a long-term recession the numbers can go down for a longer period of time.
Basic economic information can be seen at the country information pages.

Airport Catchment Areas
How Catchment Areas Are Calculated
Like mentioned each airport has a dedicated catchment area (or catchment radius) that determines how large area they can serve. This forms the basis of the demand from each airport - everything that falls under the catchment area is potential demand for this airport (but the airport might share this demand with other airports with overlapping catchment areas). The catchment area is modelled to take into account the general desirability of an airport and the fact that usually people will travel less than 1-2 hours to reach the airport to fly to another destination.
The catchment area of an airport can be anything between 50 and 210 kilometers (30 to 130 miles). The larger the airport grows, the higher the catchment area becomes.
The factors affecting the catchment radius are airport's infrastructure size class and airport's traffic size class:
- Infrastructure class determines the general level of services available at the airport, such as terminals. There are 10 levels and the biggest airports start initially at level 5 (= with room for expansions).
- Traffic class is a statistical factor based on the amount of passengers flown from the airport, there are 10 levels. This indicates how much flights there are from this airport.

At the start of a new game world the catchment areas are initially smaller (range from 50 to 120 kilometers, instead of 50 to 200 km) in order to create smaller initial demand values at the start of the new scenario. These will slowly grow towards the full numbers as the scenario progresses.
When the catchment radius is established the system will look into what actual geographical areas fall under this airport's catchment radius. In this step for example the distance from the area to airport is a factor - further away from the airport means longer travel time to it and thus a lower potential of actually using that airport from that particular location (compared to another airport that would be closer). Another factor is the previously mentioned set of border crossing rules - people do not tend to take a ferry over the sea to catch a plane for example.
Catchment Area In the Interface
The Airport Information pages show the current status level of each airport, together with information about the catchment region. You can see the size classifications and other relevant information.
The airport map is scrollable and zoomable. Using the layers button at the top-right corner of the map, you can choose additional details like the competing airport information.

Clicking the airport marker pins will bring out more information and details of the airports. In this picture you can see the catchment radius and total population of the area.

The map can be also used to view the system's data points, the world squares. This data is shown purely for informational basis and is not relevant to everyday game play. Click on the squares will show you additional information of the world area. Note that the levels (1-10) are relative within the same country only (a level 10 in tourism level in country A does not mean the same thing as in country B).

Practical Example Of Catchment Areas
We'll be using a simplified version of Finland (the country where AirwaySim was born and developed 🇫🇮😀) as our example country. For this example we've removed all but three airports (Helsinki, Oulu, Kemi) for the sake of simplicity.
At the start of a new game world
When a new game world is launched all the catchment areas are initially smaller. Based on the existing real-life historical statistics the system also determines the initial levels for the infrastructure and traffic size classes for each airport. So in this example we would see catchment radius levels as follows:
- Helsinki, 95 km
- Oulu, 60 km
- Kemi, 50 km
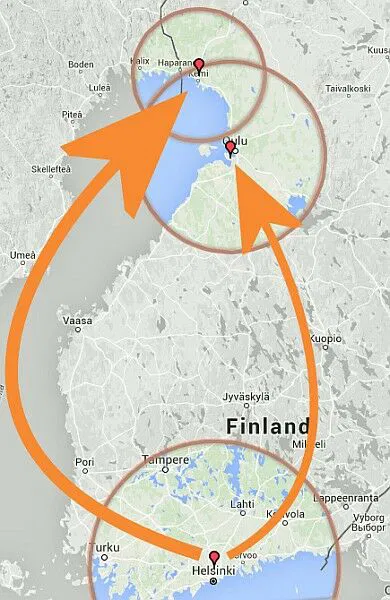
We've visualized the radiuses for you in this image (the airports are represented by the red location markers in the pictures):

You can see that in the south the radius of Helsinki will nearly cover the city of Tallinn in Estonia, over the other side of the ocean. But because of the border crossing rules no (or very few) people will actually travel with ferry in order to fly somewhere from Helsinki.
You can also see that up in the north the radius areas of Oulu and Kemi overlap a little. But since the overlap is very small, these two airports do not compete over the same demand at this time.
When a game world is progressing
Bit by bit the catchment radius of each airport will grow when the game gets going. At the first stages they will grow towards the real-life statistical based values but later on the catchment radius levels will vary according to the actions of the players. Again using our previous example, after some months of game play the airports have now the following catchment radiuses:
- Helsinki, 165 km
- Oulu, 110 km
- Kemi, 75 km
And here is the same laid out on a map:

Now the status of Helsinki as a major airport is starting to show as it reaches all the way to the cities of Turku and Tampere, both large cities. This means more potential demand for Helsinki. And again the southerly Tallinn area is not considered, even though the airport now clearly catches it.
Up in the north the airports of Oulu and Kemi are now clearly overlapping. Oulu airport is in fact even reaching the city of Kemi meaning that if there are no services from Helsinki to Kemi, people will fly Helsinki-Oulu instead and take a bus or train from Oulu to Kemi to reach their destination. Kemi airport reaches now also clearly to the neighbouring Sweden - and unlike in the south with Tallinn/Estonia, people from this part of Sweden will cross the border to fly from Finland (if the Kemi airport provides services they are looking for). We'll discuss how the two overlapping airports share their traffic in the next main chapter.
Actions by players
The actions from players will have an effect on the catchment areas of each airport, and ultimately affecting the demand from that airport.
In future versions players may (possibly) have the option to fund airport expansions, to make them grow their infrastructure faster. This increasing of infrastructure will increase the airport's catchment radius opening potential for new market areas locally.
Already in the current status of the demand system the players will affect directly to the traffic level classification of each airport, and hence affecting the catchment radius. If for example a major carrier at a large airport bankrupts and no other airline takes its place the overall traffic levels at that airport will decline, leading to a lower traffic level classification and a smaller catchment area. This in turn leads to a lower potential demand.
All of these changes are gradual and happen over a longer period of time for the sake of playability.
Airports Sharing the Demand
Like already previously explained two or several airports serving the same area can now "fight" for the same demand. Think for example the greater London area where we have Heathrow, Stansted, Gatwick, Luton and City (among others) all serving the same population and same area. Or in this example picture Ireland - Dublin area has so large catchment area that it competes directly with most of the other airports in the country for part of the demand in the middle part of the island.

In AirwaySim's City Based Demand model each of these airports can potentially take away demand from another airport serving the area.
For this to happen the catchment areas of the airports in question must overlap (the airports are then potential gateways for the local people). In larger cities there can be easily up to 3-5 airports catching the same metropolitan area, but most people tend to prefer the airport that is closest to them. Of the three desirability factors (distance to airport, airport's level of infrastructure and level of airline services) the distance is the most decisive factor and airport's infrastrcture the smallest of the three. However if there are no services to their desired destination from this closest airport, they will look elsewhere at the other airports.
In order to keep the simulation easily understandable and easily playable the demand shifts between overlapping airports happen over a longer period of time, and not instantly overnight. Like explained in previous chapters the end result of the City Based Demand calculations is the familiar airport-to-airport demand chart. The data of demand levels will vary over time and in the case of two or more airports sharing the same area the actions of the players have the biggest effect of all in the actual demand.
We've already covered previously how the system determines the airport-to-airport demand by utilizing catchment radiuses and various economic factors. At the first stages of the game all airports sharing the traffic of a city will start with rather equal levels of demand, regardless of how big or small they are in real life (considering of course the distance factors, and others explained earlier). When players start to create airlines and routes the demand will truly become dynamic and responsive to their actions.
In a nutshell: If a city has two airports and only one of them has flights while other airport sits empty and idle, all the demand will gradually move to the airport with airlines and operations.
While such transition mentioned above is simple, the system is taken beyond that and to route-specific level: Both airports have potential demand to a certain destination. If the first airport has flights to this destination but the second airport does not have, all the demand will gradually switch to the airport with flights. And even further - if both airports have flights, but the other one has a poor or limited service, the demand will again move to the better one.
Potential Demand
The Route Planning pages include new information brought by City Based Demand system. The most important of them is the Potential Demand concept.
This figure is the total possible demand this airport can catch for the selected route pair. This happens when the airport in question catches all demand also from neighbouring airports for this route pair. This happens when there are no services to the other airports for this route. We'll cover this with an example in a moment.
The following image is an example of the Route Planning demand chart from a busy cargo route. The Potential Demand is the first bar line on each weekday, showing total of 98380 kg of potential cargo demand (divided into three cargo classes).

Practical Examples
Let's take our previous example airports and use them as our example. Please note that this again is a simplified example where we are only looking at a single city area and two airports. In actual game worlds there are many more variables since many other airports can catch the same areas and there are many city areas each airport can catch.
We have Kemi and Oulu airports both covering partly the same area around the city of Kemi:

Since the catchment areas of the two airports overlap, it means that the passengers flying from/to that overlapping area can use either of the two airports in question. The airport the passengers will choose will depend on the services and the routes provided from each airport.
To use these two airports as an example, let's look only at people who wish to fly from Helsinki to Kemi (all numerical figures are examples).
Case #1: Default Situation - No Routes By Players
When there are no airlines serving any routes between Helsinki-Kemi or Helsinki-Oulu, the bulk of the demand between cities of Helsinki and Kemi will be directed to the Kemi airport.
- If the overall demand is 100 passengers per day, Helsinki-Kemi route demand will be about 65 passengers and Helsinki-Oulu 35 passengers per day.
- Even though Oulu airport is about 100 km distance from Kemi in the initial status of the calculation a portion of the people will still choose Oulu as it has by default a better service level (being a bigger airport).
- Once players will start to fly and operate the routes the demand figures will change according to players' actions.
- The figures mean that currently you could gain about 65 passengers on the Helsinki-Kemi route, but if nobody else is flying Helsinki-Oulu route, your Helsinki-Kemi route will grow to 100 passengers.
- In this case, when there are no routes at all yet, you will see the demand figures in Route Planning screen as follows:
| Sector | Current Demand | Potential Demand |
|---|---|---|
| Helsinki - Kemi | 65 | 100 |
| Helsinki - Oulu | 35 | 100 |
 Case #1: No player actions; Kemi airport receives the bulk of the demand between Helsinki and Kemi.
Case #2: Actions By Players - Some Routes Are Created
Then a player starts to operate a route between Helsinki and Oulu airports, but nobody is still flying between Helsinki and Kemi airports. This means that all of the demand between Helsinki and Kemi will start to shift towards the Oulu airport with services being provided on the sector the people wish to fly on.
- This happens, like explained, because Oulu airport is big enough to catch also the area of the Kemi city. And if no services are provided between Helsinki and Kemi, the people will choose an alternative airport.
- The overall demand of 100 passengers per day will all move to Helsinki-Oulu sector.
- This shift happens gradually for the sake of playability since sudden large movements in the demand figures can cause other undesirable issues. The time needed for the shift of the demand varies according to the amount of demand.
- All of the passengers are on the Helsinki-Oulu sector, but a portion of the demand is also displayed on the Helsinki-Kemi sector in order to encourage new routes for this sector too (the demand will never reach zero as otherwise starting a new route for this sector would be too difficult).
- Once all of the passengers have found out about the services available (the demand has shifted) you can see the following figures in the Route Planning data:
| Sector | Current Demand | Potential Demand |
|---|---|---|
| Helsinki - Kemi | 15 | 100 |
| Helsinki - Oulu | 100 | 100 |
 Case #2: Player has started to fly Helsinki-Oulu, but nobody is flying Helsinki-Kemi. The demand will shift from Kemi airport to Oulu since Oulu airport is catching the area of Kemi too.
Case #3: Actions By Players - More Routes Are Created
After this the route situation will progress according to what routes players will open. A competing airline will decide to open a route from Helsinki to Kemi, since they see that there is a potential demand of 100 passengers. This means that the demand from Helsinki to Kemi will again start to move towards the Kemi airport and away from Oulu airport (since, like we remember, people from Kemi do prefer their local airport since it's closer).
- The shift in the demand will again happen gradually, and now the Helsinki-Kemi demand will grow.
- The ratio of the demand between Kemi and Oulu will depend on the level of service the player's airlines provide, and also on the specifications of the airports.
- When the area is served by identical routes to two different airports the demand is rather equal, but still emphasis is on the nearest airport.
- In this case some people will still prefer to use the Oulu airport since it's the major airport in this region, and eventually the Route Planning screen would show the following figures:
| Sector | Current Demand | Potential Demand |
|---|---|---|
| Helsinki - Kemi | 60 | 100 |
| Helsinki - Oulu | 40 | 100 |
 Case #3: Routes are available on both Helsinki-Oulu and Helsinki-Kemi routes, demand is rather balanced.
Case #4: When Players Withdraw
If both players were to close these routes, the demand will start to move back towards the initial status (Case #1). Or alternatively if one of the two routes is closed, the situation will again start to move towards the benefit of the other route (Case #2).
Remember that the catchment area of the airports may change and this can also affect the demand of the airports. But in order to keep the playability simple you can always rely on the familiar airport-to-airport demand figures - the calculation in the background is complicated but you can always see the actual demand, and the potential maximum demand, from the Route Planning pages.