A proper aircraft performance model is an essential part of this airline simulation. Each aircraft type is different and airline operations and economics are directly affected by the capabilities of the aircraft chosen for each route. AirwaySim aims to model the overall aircraft performance and various details in a very comprehensive manner.
The AirwaySim's aircraft performance model (AAPM) consists of many parts:
- Flight performance: A complete model of flight trajectory (uses speeds for each flight segment and vertical flight profiles) in order to calculate realistic flight times and fuel burn values for each route per fleet group.
- Fuel usage: Detailed data on each combination of aircraft model / engine variant / weight variant / upgrades that compliment the flight performance data. These provide accurate fuel burn for each individual aircraft model.
- Runway performance: Data on runway requirements for takeoff and landing, determining the maximum possible payload to be carried.
- Aircraft payload: Details on aircraft weights and cargo hold capacities, as well as detailed data on range capability, allowing the calculation of what quantity and volume of payload (passengers / cargo) can be carried over a certain distance.
All these modules and data sets combined provide the overall model of aircraft performance and will result in the per-aircraft and per-route performance with exact and accurate details.
The basis of the data is from various public sources, mostly provided by the aircraft manufacturers. Real aircraft flight manuals, where available, have been also used to verify data since they provide the most detail. Note that some details on earlier aircraft models are somewhat limited as all data or manuals are not easily available. But in these cases the aircraft has been modelled as realistically as possible with the data available.
Flight Performance
The basis of each flight is the flight trajectory - how high the aircraft can climb, how long it takes to reach that level, cruising speed, how long descent takes and approach speeds etc. AirwaySim calculates a very detailed flight trajectory for each route with the aim of calculating the actual flight duration and actual fuel usage for each flight.
The trajectory model consists of data for different parts of the flight, taxi and takeoff phases, climb phase, cruise phase, different parts of the descent and approach phase, followed by landing and taxi. The maximum possible cruising level (ceiling), compared to the route length, is also considered (a short flight can't always reach the maximum possible cruise level). Each flight phase has a full set of data for speeds, performance (rate of climb/descent) and fuel usage.
Fleet Groups
Since routes for the same fleet group aircraft (e.g. B737-600 and B737-900) are interchangeable without editing (for easier management) their flight durations and flight speeds match. This means that the flight trajectory for each route is calculated on a fleet-group level, and we have chosen one aircraft model to represent each fleet group for this calculation. This model is the "average model" of the whole fleet group. For example, for the Airbus A318/A319/A320/A321 fleet the trajectory model is based on the A320. In real life of course a lighter A318 is faster to climb than a heavy A321, but usually the speed profiles for different models in the same fleet are similar so the overall flight duration is the same.
Environment
Flight trajectory models take into account the area of the world and average global winds. For example, flying eastbound over the Atlantic ocean will result in a different flying time than flying westbound. This also affects how much payload (passengers/cargo) the aircraft can carry (more of this later in this manual chapter).
On longer routes a "step-climb" procedure has been also modelled. After departure when the aircraft is heavy (due to long route) it is usually unable to climb directly to the preferred or maximum cruise level, and instead has to cruise initially at a lower level leading to higher fuel burn. Then eventually when fuel is burned the aircraft becomes lighter and is able to climb higher.
Airspace
The route distance is also factored in to the departure and arrival procedures and the fact that airways in the sky are not always a straight line from A to B. So even though in route planning you are shown the actual great circle distance between the two airports, the flight performance calculation the aircraft will fly will average about 4-8% longer distance due to the airways and procedures.
Route Editor
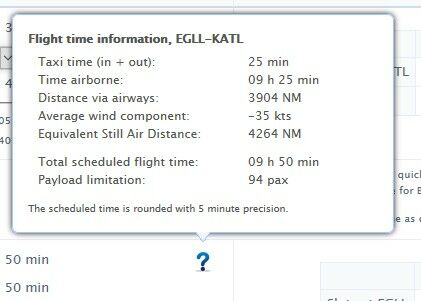
While all of the background processes are modelled in great detail, the player will normally only see the flight time result of a particular route, i.e. "route from A to B takes 3 hours 45 minutes". Some extra details of the flight duration can be seen in the route editor window when hovering the mouse / clicking over the blue question mark icon next to the flight times. The scheduled flight time is always rounded up to the nearest 5 minute.
Fuel Usage
While the basic flight trajectory is calculated on a fleet group level the fuel burn is counted for each individual aircraft, since all of them are different. Factors affecting the basic fuel burn for each flight are aircraft model, engine variant, weight variant and possible installed upgrades (such as hushkits). The actual fuel usage for each flight is calculated in a similar detailed manner. The system uses the taxi, takeoff, climb, cruise, descent and landing performance and fuel usage databases to calculate the fuel usage for the various stages of the flight to form the total trip fuel for the flight. The fuel usage for each flight for each day can be seen as fuel cost from each route's history data.
Comparing Aircraft
Even though fuel burn for each flight is calculated in a very detailed manner, for an easier comparison of aircraft models a single fuel burn value is generated for each model. This value, Average Fuel Burn, is calculated based on an average-length flight for this particular size class aircraft and is shown as single "kg / h" (or "lbs / h") fuel usage value. So this value is not an absolute figure that is applied at all stages of the flight since AirwaySim's calculations are much more detailed but is useful for quick comparison between aircraft of similar size.
The calculation of the displayed Average Fuel Burn reference value depends on the aircraft size class and each aircraft model in the same size class are directly comparable. The value is calculated by placing the aircraft into a flight of defined length (Size class Small: 200 NM, Medium 450 NM, Large 1000 NM, Very Large 4000 NM) with zero wind and approximately 80% loaded aircraft. The system then calculates the entire flight's fuel usage and flight duration, and dividing these two will give the average hourly fuel burn. The true and actual fuel burn depends on the aircraft, route, winds, weight and other factors. It is always unique for each route and aircraft combination.
Aircraft Age Factor
Besides this data, each individual aircraft has their own burn correction factor. This depends on the aircraft's age and is used to model the fact that older aircraft may not be as efficient. The burn correction will start to slowly increase when aircraft are delivered as new, reaching +5% when aircraft are 25 years old, and will stay at that level until the end. The current burn correction value can be seen from the aircraft's information page.
Aircraft Weight
The weight of an aircraft is also a large factor on fuel usage. Flying the same route with a very light passenger/cargo load might save 20-30% fuel compared to a fully loaded aircraft. This difference is modelled in AirwaySim. If you fly a route with 0% Load Factor your fuel burn for that route on that day will be much smaller than the same route flown with 100% Load Factor. Since this figure will change from day to day (based on the route sales) it cannot be directly seen at aircraft specifications but can be observed from the daily fuel cost at route details pages. Note that jet aircraft fuel burn is very much affected by the change in aircraft weight, while fuel usage for props/turboprops doesn't change as dramatically with a change in aircraft weight.
Government Subsidies
You may receive temporary or permanent subsidies from the local government based on the aircraft models you choose to operate. These can lower your fuel bill substantially. You can read more from the airports chapter of the manual: https://www.airwaysim.com/game/Manual/Routes/Airport/#Government
All the above factors combined will provide the total fuel burn for each route and each individual aircraft. The total burn is shown as the cost of the fuel and can be seen after the route has been flown (normally includes a small random element for each day, as the flight routing and traffic situation and weather is never the same from day to day).
Runway Performance
Each aircraft model has their runway performance values in the database. The required takeoff run at Maximum Takeoff Weight (MTOW) is shown at the aircraft information pages.
The required runway length for landing is not shown at the interface since it is usually the less limiting factor (the landing requirement is usually much shorter than the takeoff requirement).
Remember also that the shown runway requirement is for the maximum takeoff weight. It is not always the same thing as the runway requirement with even 100% Load Factor, since the amount of fuel on board is also factored and the aircraft does not usually reach it's maximum takeoff weight until it is flying close to the maximum range with full payload. So, for example, on a short route the aircraft is rather light, even though you might be carrying a full passenger load, and hence the aircraft requires less runway than the distance shown.
If the runway required for takeoff or landing is longer than the runway available, the system will automatically limit the payload of that flight in order to be able to fly the route (carry less passengers/cargo). If there is such a limitation in place, it is shown at the route editor page and at the route information page. The amount of payload allowed depends on the airport's runway length (both takeoff and landing) and the specifications of the aircraft.
It is always a good rule of thumb to acquire an aircraft that is able to takeoff at the full MTOW from your base airport. But, as explained above, you are also able to fly to airports with shorter runways if the route is short or you are willing to take the payload penalty by carrying less passengers/cargo.
Aircraft Payload
Besides runway performance, the amount of payload an aircraft can carry is also limited by the payload/range performance of the aircraft model. AirwaySim models the operational weights and range data for each aircraft model, and each engine and weight variant combination.
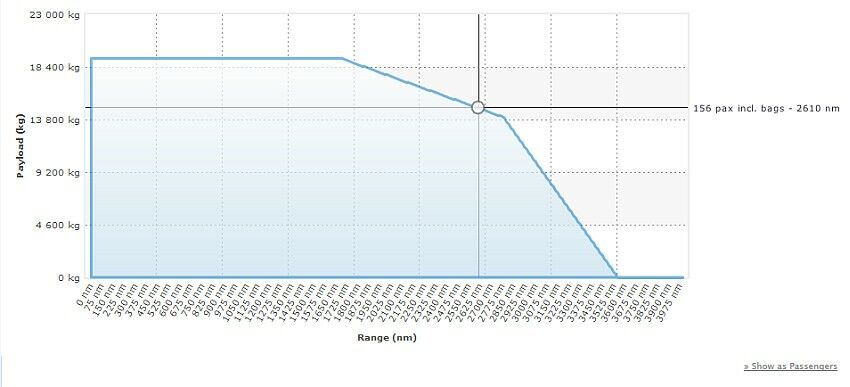
The actual payload vs. range chart can be found at all aircraft information pages, and a range map centered at your base airport is also provided. These ranges and charts are based on zero-wind conditions.
For easier comparison the system provides also a single range value called nominal range that can be used to quickly determine the range of the aircraft. This is the range of the aircraft with full passenger payload in this seat configuration. And for cargo aircraft the range with full cargo payload. So when comparing the nominal range values keep in mind that seating configuration will affect it.
For a more detailed view, you can use the actual payload vs. range charts which allows you to view the actual range with any given payload.
As with the runway limitations, you are able to fly a route that exceeds the nominal range but then the system automatically limits the possible payload (passengers / cargo) you can carry. However, the length of the route can never exceed the maximum range of the aircraft, which is the point at the very end (low right corner) of the payload vs. range chart (since that is the range limited by aircraft fuel capacity).
Different engine and weight variant combinations of the same aircraft model will usually have different performance capabilities. Usually the newer engine variants will have better performance and are normally able to fly longer distances. But they are usually more expensive to operate, so take care that you pick the right equipment for your routes.
Environmental Conditions
Global Winds
The global wind model in AirwaySim is based on actual real world data and is very accurate. The flight time and aircraft payload capability is highly effected by the enroute winds (see next chapter) and for that reason the aircraft performance model takes into account the prevailing winds.
The wind model is based on real historical wind data samples from each latitude/longitude around the world and data is taken from each month for a period of 5 years. This data has been used to calculate the average statistical wind to each area of the world in order to generate a realistic and accurate wind data for the purposes of performance calculations. It also takes into account the aircraft's cruising altitude. For a short route, or for aircraft with low cruising altitudes (such as unpressurized prop aircraft) the winds are not as strong as higher altitudes where jets normally fly.
Naturally in real life the winds change daily, but for AirwaySim purposes it looks at long-term/statistical wind components on each route to generate a realistic scheduled flight time. You can see the wind component for each individual route at the route editor screen.
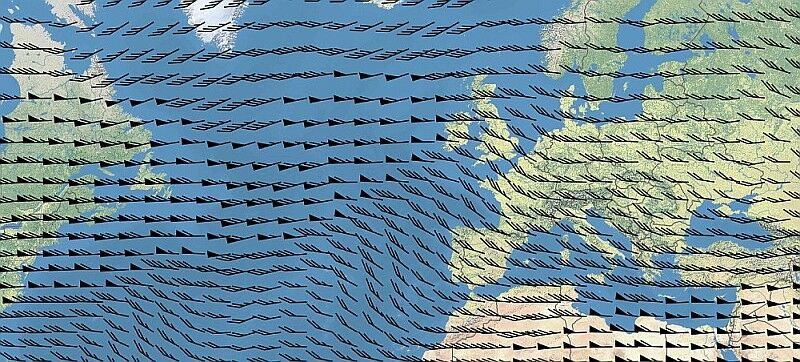
An example of the wind data is pictured below. You can see that in the North Atlantic the prevailing statistical winds are about 40 to 90 kts from about direction 230-290 degrees (single line = 10 kts, filled triangle = 50 kts).
Equivalent Still Air Distance
As previously noted the true range and payload capabilities of an aircraft will depend on the route conditions. All range values and charts are based on zero-wind conditions and the actual payload capability of an aircraft is determined when you schedule a route (the system calculates the actual flight time and fuel use).
AirwaySim calculates the payload performance in a detailed way by using the ESAD (Equivalent Still Air Distance) as a basis for all calculations. In short this means that flying a long route that has a strong headwind, the actual flight time is longer. Thus, aircraft need more fuel and can carry less payload. And vice-versa if flying with a strong tailwind where flight times are shorter.
The calculated ESAD value can be seen at route editor window when hovering mouse / clicking over the blue question mark icon next to the flight times.
If you are flying an aircraft close to the limits of its payload capabilities you may see a greatly different payload limitation on one way of the route compared to the return. For example, when crossing the Atlantic you will have strong headwinds one way and you may be able to only carry only 50 passengers; while on the return leg with a strong tailwind you might be able to carry 150 passengers.
The route editor and information pages will always give you the accurate data once the route is scheduled to an aircraft.


